Brand Equity Measurement Frameworks for Mid-Market CMOs
How to close the gap between brand perception metrics and the financial proof CFOs require.

Mid-market CMOs have a credibility problem, and the data behind it is specific: brand equity as a concept is sound, but the way it gets measured and reported to the C-suite is not. Closing that gap means building a measurement system that pulls from customer perception research, financial modeling, and now, increasingly, the way AI systems evaluate and recommend brands. Skipping the third layer leaves the whole system already out of date, no matter how good the first two look on a slide.
Why Mid-Market CMOs Lose the Boardroom Argument on Brand
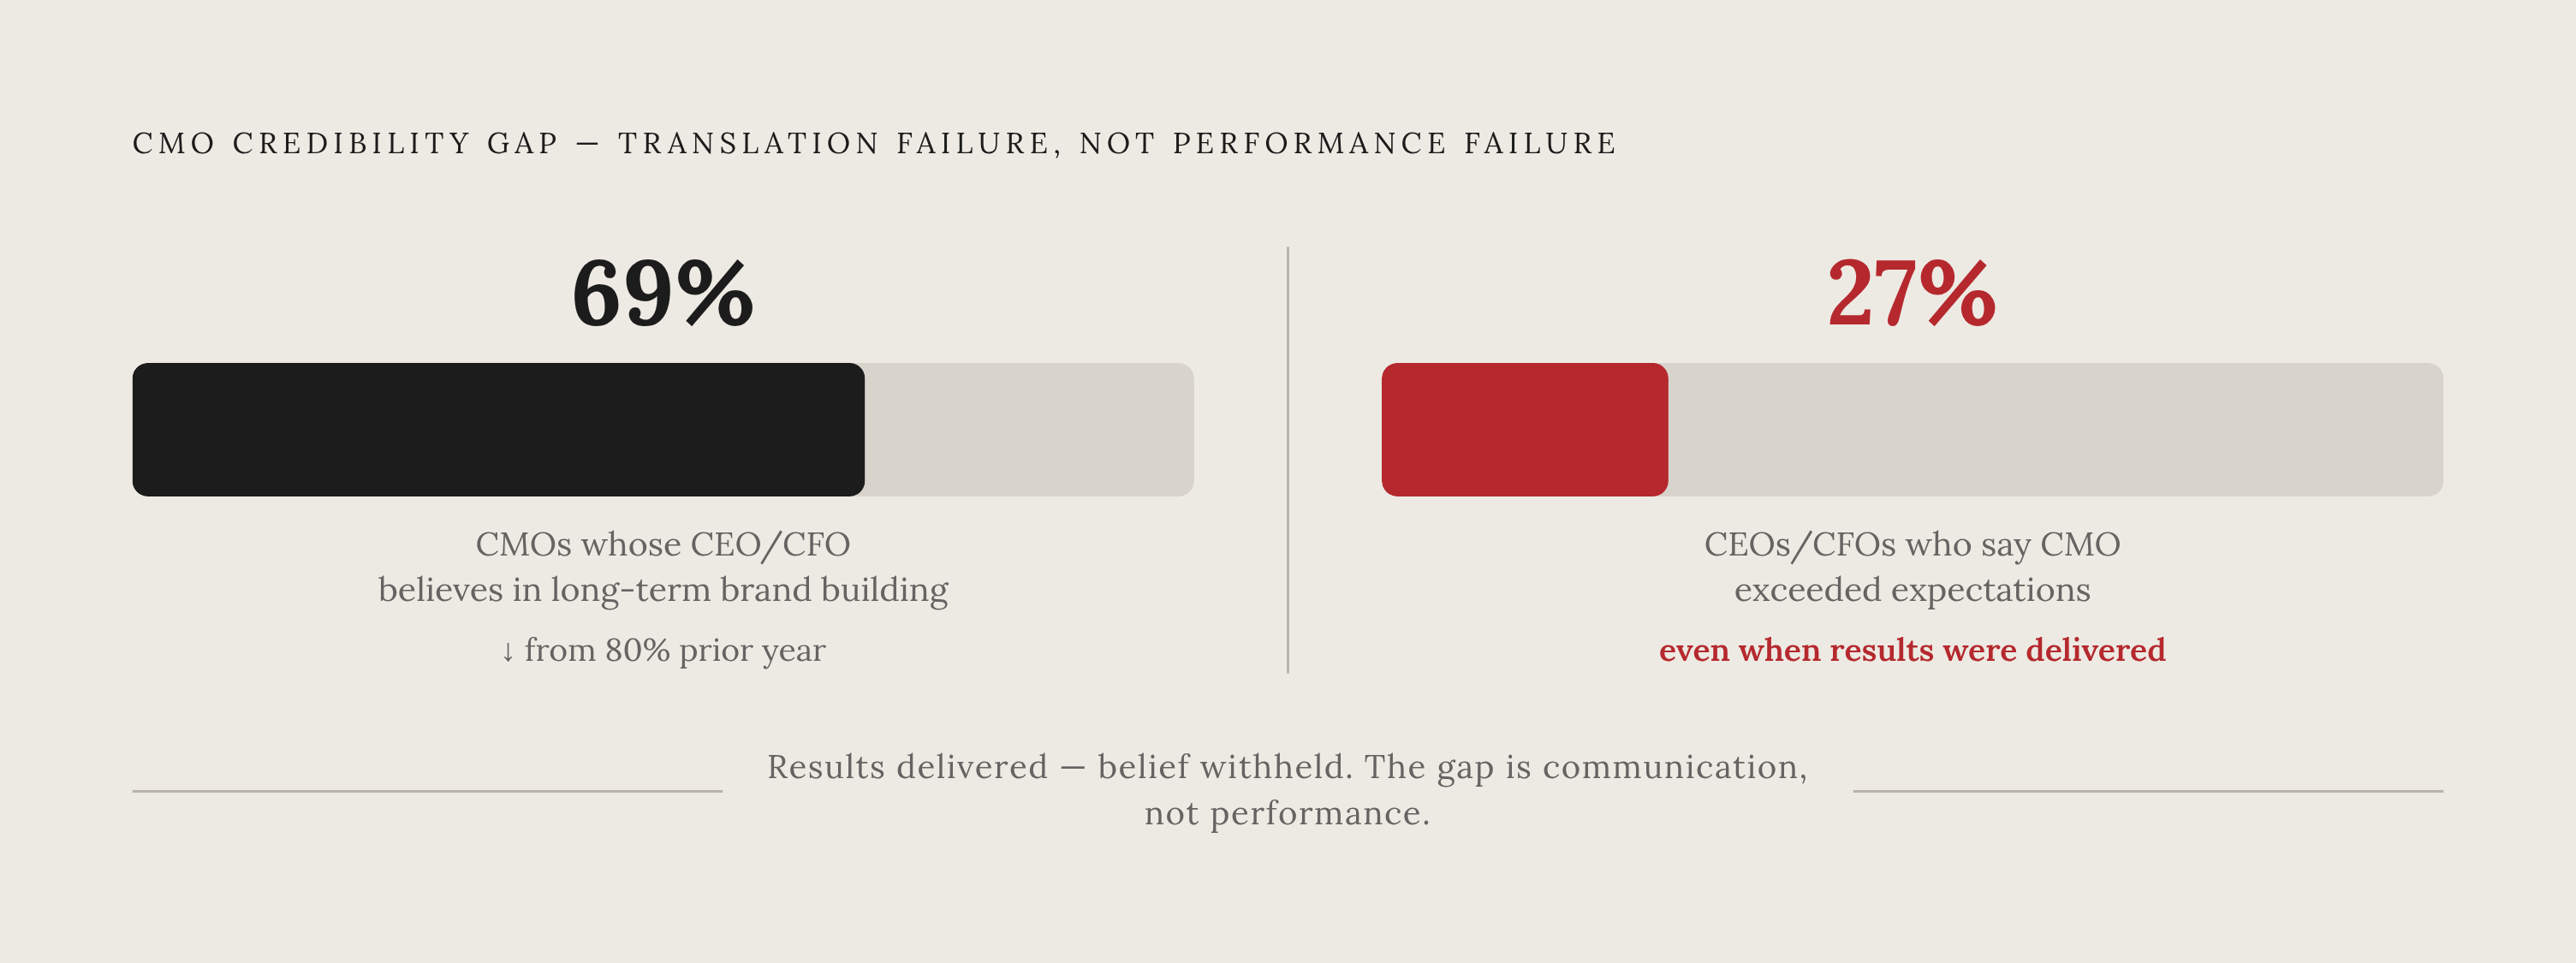
The trust gap is widening. Only 69% of CMOs say their CEO or CFO believes in long-term brand building, down from 80% the year before. That's a ten-point drop in one cycle, and it's happening while marketing budgets face more scrutiny than ever.
Gartner's research points to something sharper than budget pressure: only 27% of CEOs and CFOs believe their CMO exceeded expectations, even in cases where marketing delivered real commercial results. The results were there without the belief to match them. That's a translation failure, not a performance failure: the number that would prove the work happened never makes it into the room in language the CFO trusts.
Only 3% of CMOs can currently show ROI on more than half of their spend. That's most of the marketing budget sitting in a black box as far as the CFO is concerned, and it's the real reason brand gets cut first in a lean quarter. Enterprise companies paper over this with dedicated brand valuation teams and long-standing agency retainers built specifically to translate soft metrics into financial language. Mid-market CMOs don't have that scaffolding, and pretending otherwise is the mistake. They need to build the same rigor with a fraction of the headcount and none of the multi-year runway. They need to pick a smaller, sharper set of numbers rather than copying the enterprise playbook wholesale.
Brand Equity Before Measurement
Brand equity and brand value get used as if they're the same word, and that habit is where a lot of CMOs lose the room. Equity is perception and behavior, the associations customers hold, the loyalty they show, and their recognition of the brand in a crowded category. Value is a dollar figure on a balance sheet or an M&A term sheet. Presenting one when the CFO asked for the other is how a CMO loses credibility in a single meeting.
The definition that survives across every major framework traces back to a marketing researcher's foundational work: brand equity is the differential effect of brand knowledge on how a consumer responds to marketing. Stripping the branding off a product makes the price tolerance disappear with it. What's left over is the equity, and it's measurable precisely because it vanishes when you remove the name.
This isn't an academic distinction. In B2B purchasing, over 85% of B2B decision-makers are inclined to shortlist vendors they already recognize and trust, which is the shortlist mechanism working in real time, not a survey artifact. Equity isn't a score that sits still, either. It gets built through the full experience a customer has with a company (its product, its service, its ecosystem, its community) not through a quarterly ad campaign bolted on top.
Three customer-based frameworks worth knowing and what each one measures
Keller's Customer-Based Brand Equity Pyramid moves in four stages: salience (does anyone know the brand exists), performance and imagery (what does the brand mean), judgments and feelings (how do people respond to it), and resonance (is there an actual relationship there). It only works bottom-up, and CMOs who try to skip straight to resonance end up with equity that collapses under pressure, because emotional loyalty can't be engineered on top of a brand nobody's heard of. The pyramid's real value is diagnostic. It shows which layer is holding growth back.
Aaker's Five-Dimension model breaks equity into loyalty, awareness, perceived quality, brand associations, and proprietary assets like a logo, a color, or a sound mark. Its strength isn't originality, it's translation: the five dimensions give marketing, finance, product, and regional teams a shared vocabulary, connecting brand health to commercial variables like pricing power and channel leverage. When a CMO needs the CFO to co-own the brand conversation instead of waving it off, Aaker is usually the framework doing that work.
Kantar's Meaningful-Different-Salient model treats each dimension as its own lever, and this is the one built for triage rather than description. A brand scoring low on Meaningful has a product or message problem. Low on Different points to a creative and distinctive-asset problem. A brand isn't showing up in enough buying moments when it scores low on Salient, which raises a mental availability gap. Kantar's own research ties the combined MDS score to share growth, price premium, and share-price performance over time: brands strong across all three tend to grow faster and hold pricing better than the rest of their category.
NIQ's Brand Strength model takes the most finance-friendly angle of the four, replacing stated preference with observed trade-offs. It combines appeal and pricing power to answer a question finance already asks in other contexts: how many people would choose this brand, and what will they pay for it. That's a revenue question wearing a brand-metric costume, and it lands in the boardroom better than most perception scores do.
Building the financial layer that makes brand equity defensible to a CFO
Customer-based frameworks produce perception scores. CFOs allocate capital against numbers tied to revenue, margin, and cash flow. Until someone builds the bridge between the two, brand spend reads as a discretionary line, first on the list when a quarter turns lean, no matter how strong the underlying equity actually is.
The financial case isn't thin, it's just poorly translated. Strong brands add an average of five points to shareholder returns, and companies with a clear brand strategy see 20 to 30% higher long-term ROI. The argument already exists. It just needs the right inputs sitting under it.
Four numbers do most of the work, and none of them require a valuation firm to produce. Price premium tracks what percentage above category average a brand can charge, and whether that premium is holding or eroding quarter over quarter. Margin contribution attributable to brand separates revenue that came from loyalty and preference from revenue that came from a discount code. Customer lifetime value differential compares branded acquisition cohorts against non-branded ones, and the size of that gap is the clearest financial fingerprint equity leaves behind. Market share resilience during price shocks, the kind seen across the 2022-2024 inflation cycle, shows that a brand maintained its competitive position while holding premium pricing, which is a leading indicator of equity, not a lagging one.
Vivaldi triangulates customer-based metrics, touchpoint-level interaction data, and financial valuation models, in the same spirit as the methodologies behind Interbrand and BrandZ. That kind of triangulation turns brand strength into something closer to a discounted cash flow projection, tying it to enterprise value in language a finance team doesn't need translated twice.
The measurement system is already incomplete if it ignores how algorithms evaluate the brand
AI systems are active evaluators now, deciding what gets summarized, what gets recommended, and what makes a shortlist before a human ever sees it. They're active evaluators, deciding what gets summarized, what gets recommended, and what makes a shortlist before a human ever sees it. Google's AI Mode alone has crossed 1 billion monthly active users, which puts it well past niche behavior and into mainstream front door territory for buying decisions.
The purchasing data confirms the shift. A 2025 survey found that 54% of software buyers used at least one generative AI tool during their most recent purchase process, most often during early research, before a human sales rep or a branded landing page ever entered the picture. The early consideration phase, the exact moment where brand equity traditionally does its work, now gets filtered through a model first.
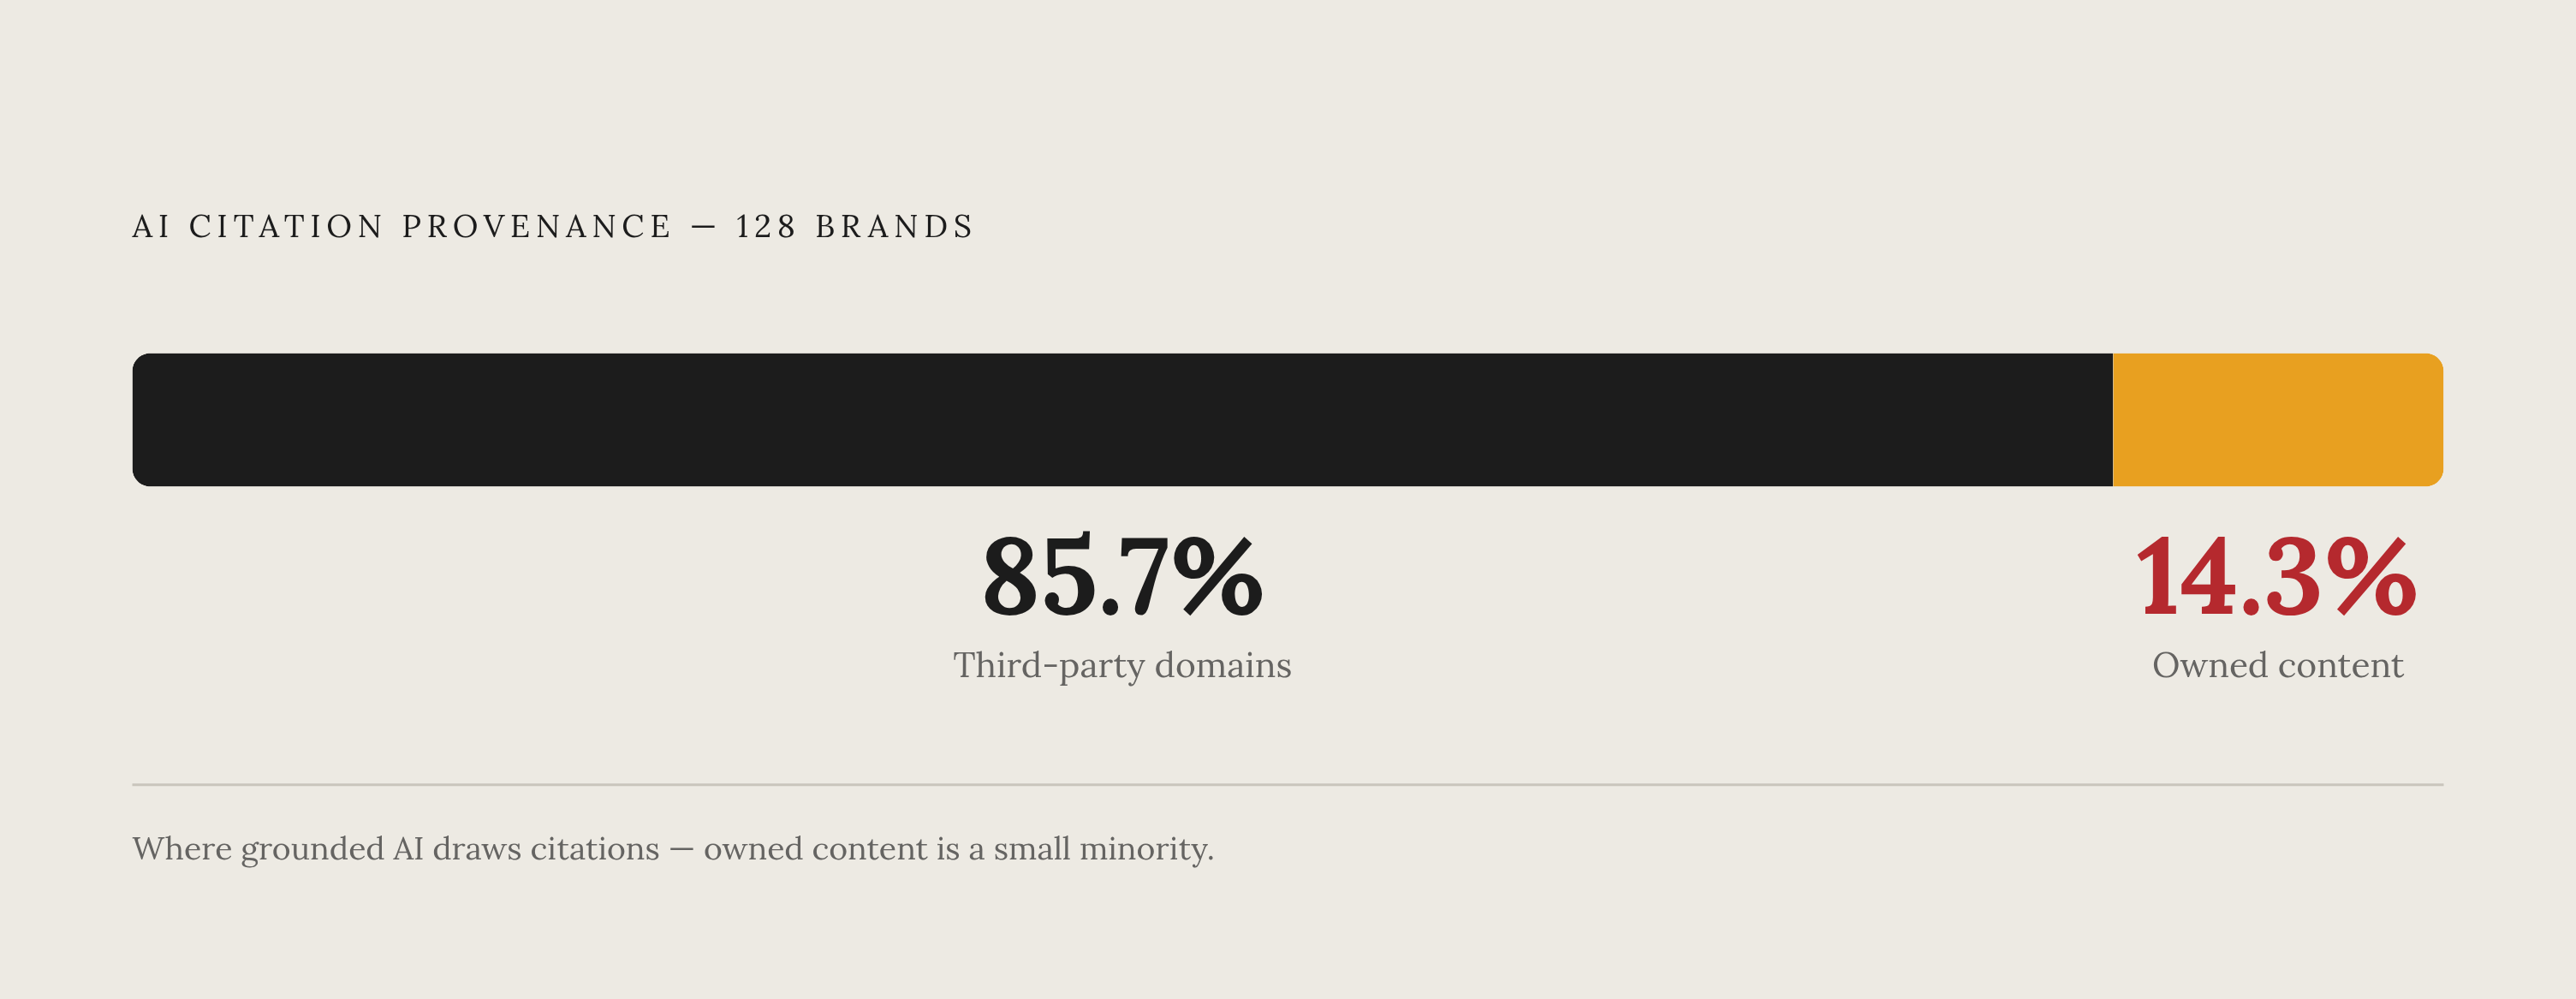
What's unsettling for CMOs used to the old playbook is that AI brand perception doesn't respond to the same inputs as human perception. It's shaped by entity signals, patterns baked into training data, and citation architecture, not by ad reach, awareness campaigns, or PR placements. A 128-brand citation-provenance study found that 85.7% of the URLs a grounded model cites when discussing a brand point to third-party domains the brand doesn't own or control. Owned content, the website, the blog, the carefully worded About page, is largely not what these systems draw on to describe a company. That single number should reorder how marketing teams think about where their brand narrative actually lives online, because it doesn't live where most of them are still investing.
What AI Systems Evaluate When Recommending a Brand
Four dimensions determine how a model represents a brand, and each one needs a different fix rather than a single "AI visibility" campaign thrown at all of them at once. Accuracy asks whether what the model says about the brand is factually correct. Depth asks how richly it can describe the brand's category expertise, versus a thin, generic mention. Sentiment asks whether the tone leans positive, neutral, or hedged and cautious. Recommendation frequency asks the sharpest question of the four: when someone asks the model for options in a category, is the brand named.
The concentration data here is stark, and it cuts against the "just show up eventually" assumption a lot of CMOs are still running on. A fifty-brand, five-industry study found a mean Gini coefficient of 0.28 for how concentrated recommendation share is among competing brands, alongside 41.6% cross-model agreement on which single brand ranks as the top recommendation across three different model families. A small set of brands is capturing most of the attention in any given category. That's bad news for anyone already outside that set, but it also makes early positioning unusually valuable for challengers willing to move now instead of waiting for the category to settle.
Separate research into AI brand dynamics suggests that incumbent brands carry a structural advantage in what models choose to recommend. The AI perception gap for a mid-market brand chasing a category leader will not close on its own. It takes sustained, deliberate work, the practice increasingly called generative engine optimization, aimed at the signals models actually weigh: structured data through schema markup, third-party mentions from sources with real authority, consistent business information across every platform that lists the brand, recurring positive review sentiment, and clean technical implementation across the properties the brand actually controls.
LLM perception drift as a measurable brand health signal
Call it LLM perception drift, the measurable shift in how AI systems describe, rank, and recommend a brand over time. It's shaping up as one of the defining visibility metrics heading into 2026, sitting alongside share of voice and keyword rank as something marketing teams track on a schedule, not something they check when someone happens to ask.
The project management software category shows how fast this moves. In a tracked period, Atlassian's AI recommendation share climbed noticeably, while Trello, Slack, and Monday.com all posted measurable drops in the same window. These rankings are not static snapshots, they're moving targets, and a brand that looks strong in an AI recommendation audit this quarter has no guarantee of holding that position into the next.
The metric worth pairing with drift is stability, how consistent a brand's model-generated description and positioning stay across repeated queries over time. Sharp, erratic swings point to weak semantic anchoring, a brand the model hasn't settled on yet, vulnerable to the next training update or a competitor flooding the space with new content. A stable signal means the model has formed a settled, dependable read on what the brand is and does. Mid-market CMOs who start tracking this now are building a historical baseline while it's still cheap and quiet to do so. Waiting until volatility hits means trying to explain a drop with no prior data to show what normal used to look like, which is a much harder conversation to have with a CFO than the one about starting early.
Building the triangulated measurement system within mid-market resource constraints
None of this requires a sprawling dashboard nobody opens after the first quarter. It requires triangulation: one customer-based signal, one financial proxy, and one AI perception signal, reported together, every quarter, in a form the CFO actually reads. A tight three-part report that gets used beats a twenty-tab tracker that gets ignored, every time, and mid-market teams should build for the former even if it feels less thorough on paper.
The first layer is customer-based perception. Pick one framework as the diagnostic spine: Aaker if cross-functional alignment is the priority, MDS if predicting share growth matters most, NIQ's Brand Strength model if the goal is speaking the CFO's language directly. Run the tracking survey quarterly, not annually, because annual studies were built for a world that moved slower than the current AI search environment does. Social listening fills the gaps between formal surveys, surfacing sentiment and association themes across real conversations without the cost of commissioning a fresh study every time leadership asks a question.
The second layer is financial proxy data. Track price premium against category average every quarter. Track the LTV gap between branded and promotionally driven acquisition cohorts. Watch branded search volume as a rough stand-in for unaided mental availability: if that number climbs without a matching bump in ad spend, equity is compounding on its own. Split internal reporting into velocity metrics for the performance conversation and equity metrics for the brand investment conversation, so the CFO gets the number that actually matches the argument being made.
Most mid-market brand systems are still missing the third layer. Run a monthly audit of AI recommendation frequency across the two or three AI tools the target buyer segment actually uses, not every model on the market, just the ones that matter to that audience. Alongside it, track an AI brand signal stability score, measuring how consistently the brand gets characterized across model outputs over time. Neither audit needs an enterprise budget. Both need someone senior enough to notice when the pattern breaks, and to say something before the CFO does.